这篇文章介绍如何在基于树莓派的Pi-Hole系统中添加OLED12864状态显示屏。
Pi-Hole是一个可以在树莓派上运行的广告拦截程序,其可以在树莓派1代到4代上完美运行。具体的信息可以在其官网上了解。
在树莓派3B+上设置Pi-Hole之后,我想要一种添加显示器的方法,这样我就可以快速检查它是否在工作。 因此,我添加了0.96英寸OLED显示屏和轻触开关。 开关用来切换屏幕显示的信息,当然你也可以修改代码直接在程序里切换。
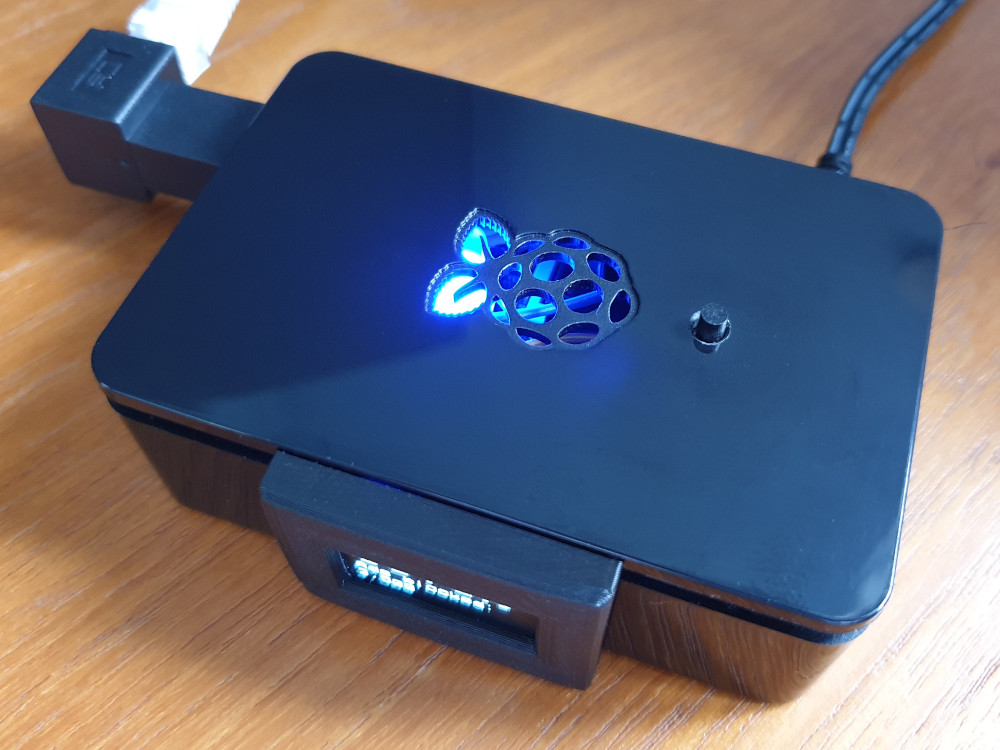
硬件
这个项目里面用到的器件如下:
- 树莓派 (任意版本,最好有网口)
- TF卡 (推荐8G+)
- 电源(没啥好说的)
- 有网!!!
- 网线
- 板载WiFi
- USB无线网卡
- 显示器(可选)
- 键盘(可选)
- 保护壳
屏幕和轻触开关:
安装Pi-Hole并配置
安装Pi-Hole非常简单,因此我不重复这个过程了,需要的朋友可以看我别的文章,以下简述需要的东西:
- 用Etcher安装树莓派镜像Raspbian Lite或者带桌面的Raspbian
- 在启动分区中添加名为“ ssh”的空文本文件以启用SSH
- 插入TF卡启动树莓派
- 运行
sudo apt-get update和sudo apt-get upgrade - 获取IP地址:
- 运行ifconfig(有屏幕的情况下)
- 从路由器管理页面获取
- 使用网络扫描软件
- 为树莓派设置静态IP
- 使用一键安装的方式安装Pi-Hole:
curl -sSL https://install.pi-hole.net | bash
连线
开关使用杜邦线直接连接到GPIO接口,然后用环氧树脂胶粘在盖子上。
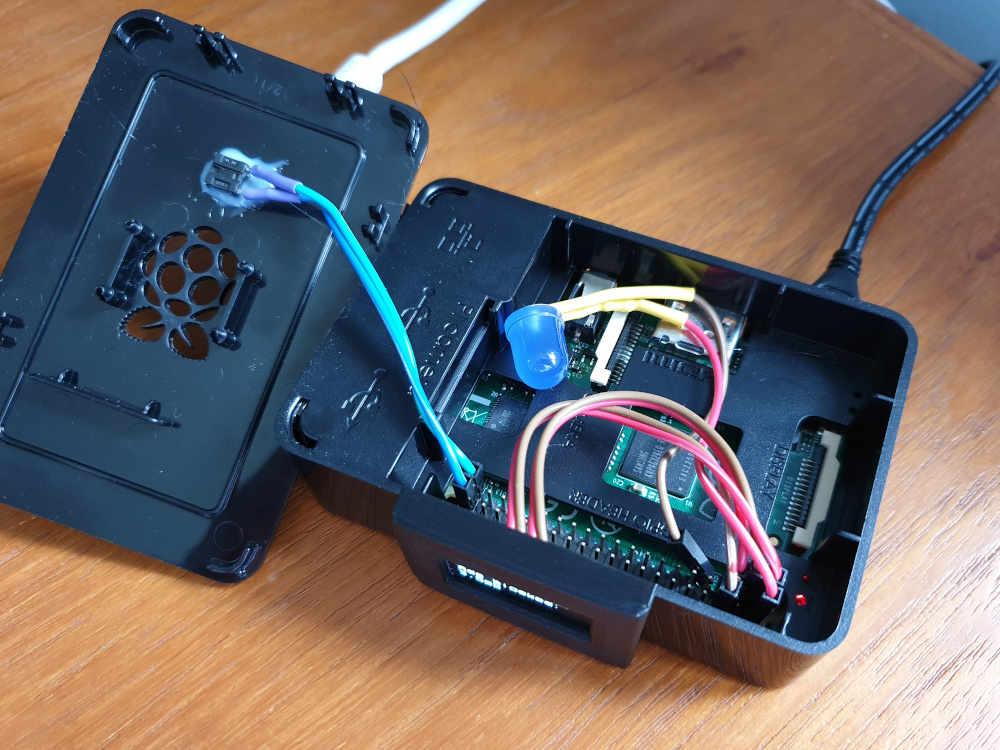
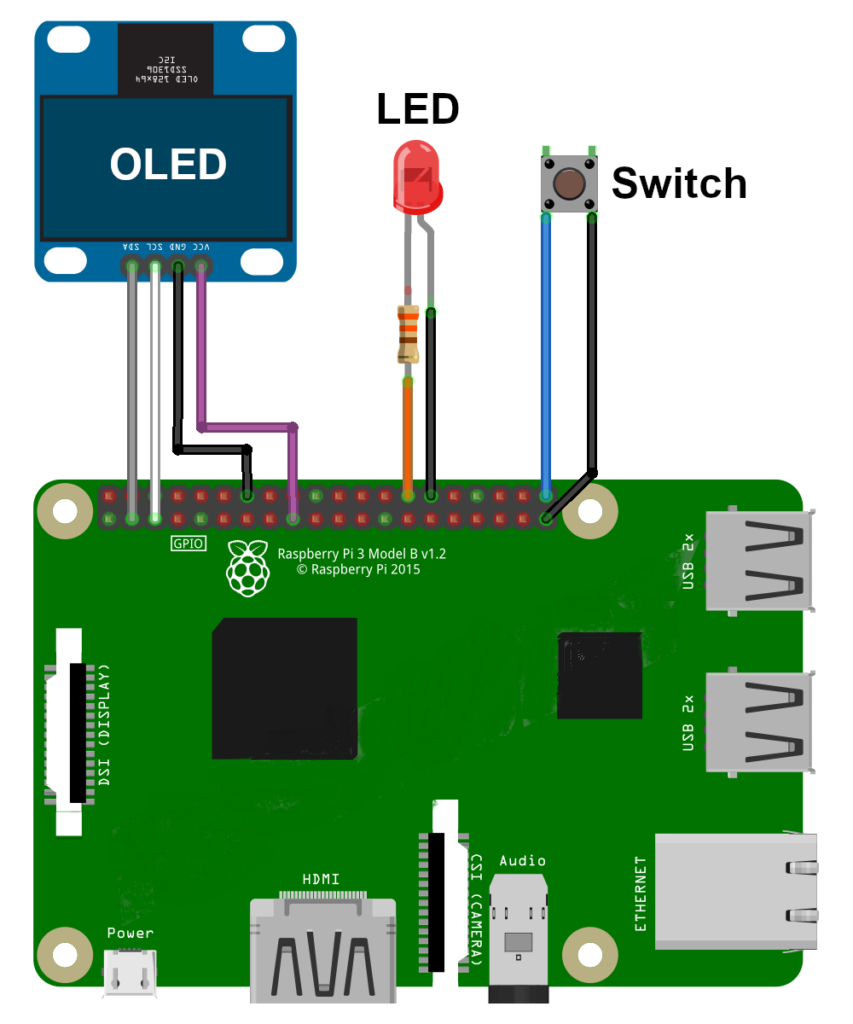
屏幕,开关和LED的接线如下所示:
OLED12864配置
使用I2C协议的OLED12864屏幕连接非常简单。 在我的《树莓派使用OLED12864》教程中可以找到将其添加到树莓派并安装库的过程。
确保教程中的代码可以运行并可以看到显示的内容。
轻触开关
开关可以直接连接到GPIO接口。我将其跨接在GPIO21(引脚40)和地(引脚39)之间,按下开关使得GPIO21从高电平变为低电平。
Python脚本
Python脚本使用Pi-Hole API来获取运行数据并在处理后显示在屏幕上。
代码如下:
#!/usr/bin/python3
import time
import math
import json
import requests
import subprocess

# Graphics libraries
from PIL import Image
from PIL import ImageDraw
from PIL import ImageFont

# Adafruit library for I2C OLED screen
import Adafruit_SSD1306

# GPIOZero functions for buttons and LEDs
from gpiozero import Button
from gpiozero import PWMLED

def button_presssed():
  global mode
  if mode==1:
    mode=0
  else:
    mode=1

# Define GPIO pins used by button and LED
ButtonGPIO=21
LEDGPIO=24

# Configure button connected to GPIO21 (Pin 40) and Ground (Pin 39)
button = Button(ButtonGPIO)
button.when_pressed = button_presssed

# Configure LED connected to GPIO24 (Pin 18) and Ground (Pin 20)
led = PWMLED(LEDGPIO)
led.value=0

# 128x64 display with hardware I2C:
disp = Adafruit_SSD1306.SSD1306_128_64(rst=None)
# disp = Adafruit_SSD1306.SSD1306_128_64(rst=None, i2c_address=0x3C)
# disp = Adafruit_SSD1306.SSD1306_128_32(rst=None, i2c_bus=2)

# Initialize library.
disp.begin()

# Clear display.
disp.clear()
disp.display()

# Create blank image for drawing.
# Make sure to create image with mode '1' for 1-bit color.
width = disp.width
height = disp.height
image = Image.new('1', (width, height))

# Get drawing object to draw on image.
draw = ImageDraw.Draw(image)

# Draw some shapes.
# First define some constants to allow easy resizing of shapes.
padding = 0
top = padding
bottom = height-padding
# Move left to right keeping track of the current x position for drawing shapes.
x = 0

# Load Truetype font from https://www.dafont.com/bitmap.php
# VCR OSD Mono by Riciery Leal
font = ImageFont.truetype('VCR_OSD_MONO_1.001.ttf',15)
font2 = ImageFont.truetype('VCR_OSD_MONO_1.001.ttf',40)

# Draw a black filled box to clear the image.
draw.rectangle((0,0,width,height), outline=0, fill=0)
# Show Start Script text
draw.text((x, top), "Start Script",  font=font, fill=255)
disp.image(image)
disp.display()

# Default mode, show large percentage
mode=0
counter=1

while True:

  # As counter cycles from 1-30 we generate LED value
  led.value=counter/30

  if mode==0 and counter>29:

    # Get Pi-Hole data
    r = requests.get("http://localhost/admin/api.php?summary")

    # Scroll from right-hand side (x 128 to 0 in steps of 16)
    for x in range(128,-1,-16):

      # Draw a black filled box to clear image.
      draw.rectangle((0,0,width,height), outline=0, fill=0)

      # Display large Pi-Hole ads blocked percentage
      draw.text((x, top-2),   "%s%%" % r.json()["ads_percentage_today"],  font=font2, fill=255)
      draw.text((x, top+34),   "Ads blocked:", font=font, fill=255)
      draw.text((x, top+48),   "%s" % r.json()["ads_blocked_today"], font=font, fill=255)

      # Display image.
      disp.image(image)
      disp.display()

    counter=0

  if mode==1:

    # Draw a black filled box to clear the image.
    draw.rectangle((0,0,width,height), outline=0, fill=0)

    # Get system data
    # Shell scripts for system monitoring from here : https://unix.stackexchange.com/questions/119126/command-to-display-memory-usage-disk-usage-and-cpu-load
    cmd = "hostname -I | cut -d\' \' -f1"
    IP = subprocess.check_output(cmd, shell = True )

    # Write Pi-Hole data
    draw.text((x, top),      str(IP.decode('UTF-8')),  font=font, fill=255)
    draw.text((x, top+16),   "B: %s%%" % r.json()["ads_percentage_today"],  font=font, fill=255)
    draw.text((x, top+32),   "A: %s" % r.json()["ads_blocked_today"], font=font, fill=255)
    draw.text((x, top+48),   "Q: %s" % r.json()["dns_queries_today"], font=font, fill=255)

    # Display image.
    disp.image(image)
    disp.display()
    time.sleep(6)

    # Draw a black filled box to clear the image.
    draw.rectangle((0,0,width,height), outline=0, fill=0)

    # Get system data
    # Shell scripts for system monitoring from here : https://unix.stackexchange.com/questions/119126/command-to-display-memory-usage-disk-usage-and-cpu-load
    cmd = "top -bn1 | grep load | awk '{printf \"C: %.2f\", $(NF-2)}'"
    CPU = subprocess.check_output(cmd, shell = True )
    cmd = "free -m | awk 'NR==2{printf \"M: %s/%sMB\", $3,$2 }'"
    MemUsage = subprocess.check_output(cmd, shell = True )
    cmd = "df -h | awk '$NF==\"/\"{printf \"D: %d/%dGB\", $3,$2}'"
    Disk = subprocess.check_output(cmd, shell = True )

    # Display system stats
    draw.text((x, top),       str(IP.decode('UTF-8')),  font=font, fill=255)
    draw.text((x, top+16),    str(CPU.decode('UTF-8')), font=font, fill=255)
    draw.text((x, top+32),    str(MemUsage.decode('UTF-8')), font=font, fill=255)
    draw.text((x, top+48),    str(Disk.decode('UTF-8')),font=font, fill=255)

    # Display image.
    disp.image(image)
    disp.display()
    time.sleep(6)

    mode=0
    counter=29

  counter=counter+1
  time.sleep(1)
下载必须的字体库文件:
wget https://bitbucket.org/MattHawkinsUK/rpispymisc/raw/master/pihole/VCR_OSD_MONO_1.001.ttf编辑crontab文件使得该脚本能够开机运行:
crontab -e
在文件中加入如下内容:
@reboot python3 /home/pi/stats.py &保存并退出。
重启树莓派,脚本将在30秒后在屏幕上显示Pi-Hole数据。30秒的延迟使得树莓派有时间完成联网以及初始化配置。OLED显示后可以通过按键切换显示的内容。
显示的信息
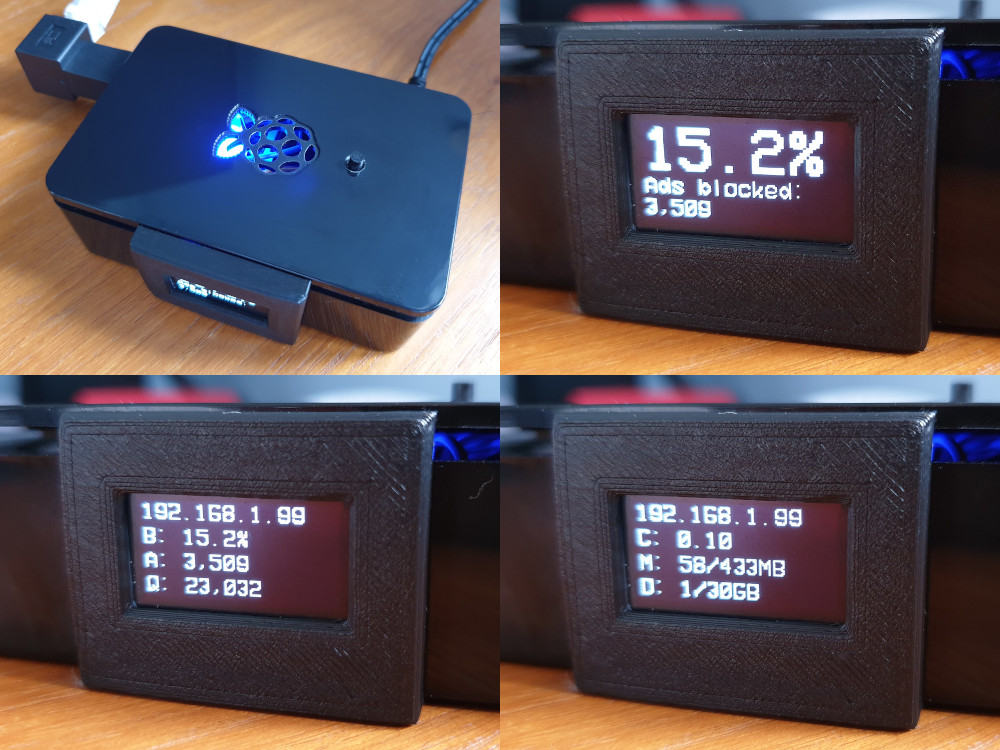
主屏幕每30秒滚动并刷新一次数据,按键在此只是为喜欢不停刷新的同学提供方便。
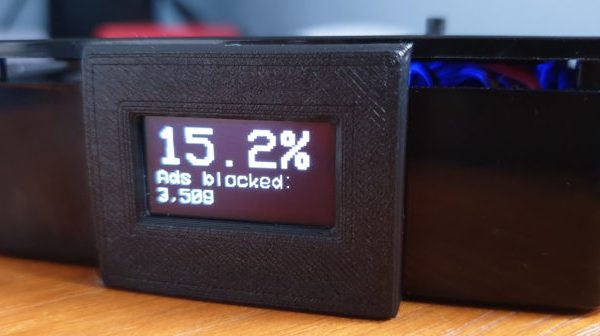
显示的内容:
- 第一屏
- 拦截广告的百分比
- 总拦截数
- 第二屏
- IP地址
- 拦截的百分比
- 拦截数
- 发现的总广告数
- 第三屏
- IP地址
- CPU利用率
- 内存占用/总内存
- 硬盘占用/总容量
留言